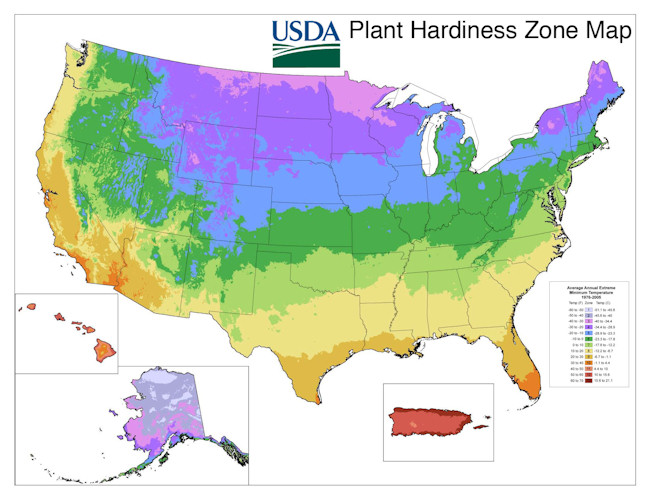
USDA Launches First New Hardiness Zone Map Since 1990
Posted in Adult Education, Gardening Tips on January 30 2012, by Joyce Newman
New Yorkers may wake up tomorrow in a warmer zone, according to the just-released, internet-friendly 2012 USDA Hardiness Zone Map.
 The U.S. Department of Agriculture has just released a new version of its Plant Hardiness Zone Map (PHZM) for the first time since 1990, updating individual zones with much greater accuracy and detail. This could mean a shake-up for seed distributors and gardeners alike, with a slightly different range of plants being recommended for certain regions across the country.
Also for the first time, the new map offers an interactive format using the Geographic Information System (GIS) and the map website incorporates a “find your zone by ZIP code” function.
The map—jointly developed by the USDA’s Agricultural Research Service (ARS) and Oregon State University’s PRISM Climate Group–now includes 13 zones; compared to the 1990 version, zone boundaries have shifted in many areas. The zones of the United States on the new map are generally five degrees Fahrenheit warmer than those of the previous version.
Each zone on the map is composed of a 10-degree band, further divided into five-degree “A” and “B” zones.
The map uses data measured at weather stations during the 30-year period between 1976 and 2005. In contrast, the 1990 map was based on temperature data from only a 13-year period between 1974 and 1986. (This temperature data is not to be confused with climate change data. When climate change is studied, scientists look for trends in overall average temperatures over a much longer, 50- to 100-year period.)

Some of the changes in the zones are a result of new, more sophisticated methods for mapping zones between weather stations. These include algorithms that consider for the first time such factors as changes in elevation, nearness to large bodies of water, and position on the terrain, such as valley bottoms and ridge tops.
Further, the new map uses temperature data gathered from many more weather stations than were used in the creation of the 1990 map. These advances greatly improve the accuracy and detail of the map, especially in mountainous regions of the western United States. In some cases, these more accurate findings actually resulted in changes toward cooler, rather than warmer, zones.
Unfortunately, the USDA has no plans as of yet to print posters of the Plant Hardiness Zone Map, so you will not be able to order one for your wall. But national, state, and regional versions of the map can be downloaded and printed in a variety of sizes and resolutions.
The NYBG horticulturists working in the Home Gardening Center this spring might just have their hands full with new crop suggestions, thanks to a shifting range of plants recommended for New York State. Will any of our readers be changing their garden roster as well?
Zone map courtesy of the USDA.

