Blue Zones: Identifying Adaptation Opportunities Using Past, Present, and Future Flooding in New York City
Lucinda Royte is the Manager of Urban Conservation Data, Tools, and Outreach at NYBG
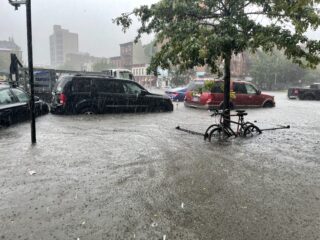
This week, our paper “Blue Zones: Identifying Adaptation Opportunities Using Past, Present, and Future Flooding in New York City” was published in the Annals of The New York Academy of Sciences. My interest in this topic was piqued in 2021 when the remnants of Hurricane Ida dumped an unprecedented 3.15 inches of rain in a single hour, completely overwhelming infrastructure built to handle around 1.75 inches. That night, I walked home across what used to be Gowanus Creek calf-deep in sewage water from overflowing catch basins surrounding what’s now known as the Gowanus Canal. My Blundstones were never the same. The following day, looking at maps of where flooding had occurred, I noticed something I’d seen before: water returning to where it had historically been. But unlike during Hurricane Sandy, in 2012, when coastal flooding returned to landfilled saltmarshes, Ida had revived upland ponds, streams, and freshwater marshes.
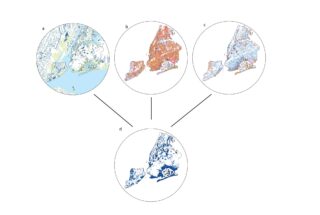
Block-level flood risk in New York City in the (a) past; (b) present; (c) future; and (d) Blue Zones, which find the intersection of past, present, and future flood risk
At the time, I was working for Dr. Eric W. Sanderson on his project revealing the historical ecology of New York City. With a push from the New York Department of Environmental Protection, we began to seriously consider the role of historical hydrology and topography when predicting flood-vulnerable areas of New York City. For our paper, we hypothesized that wet places will be wet again, and we aimed to provide information on the causes of flooding to urban planners struggling to tackle the dual crises of climate change and housing shortages.
Over the next four years Dr. Sanderson and the Urban Conservation team at the New York Botanical Garden built a comprehensive ecological history dataset of 17th-century New York City, completing an already 20-year-long process of georeferencing and digitizing maps, synthesizing datasets, and running spatial analyses. The outcome was a reconstructed view of the topography, hydrology, and geology of the land that would become New York City, complete with plant and animal species lists for each of the mapped ecosystems, and information on where the Indigenous Lenape people lived, hunted, gathered, and farmed. To view this data, visit our interactive webtool at welikia.org.
Once we had consensus on the places that used to be wet, we started comparing our maps with maps of places that are currently wet, and with places that are projected to be wet in the future. For current flooding we drew on four datasets: the 311 service call system, DEP Stormwater Flood Maps, FEMA’s Preliminary 100-year floodplain, and the Hurricane Sandy inundation zone. For future flooding, we incorporated DEP’s moderate and extreme stormwater projections with sea level rise and FEMA’s 500-year floodplain — an important addition given that climate change is expected to increase both the frequency and intensity of storms like Sandy and Ida.
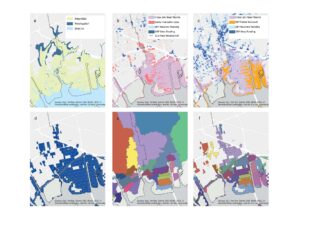
Blue Zone case study on the border of the boroughs of Brooklyn and Queens, New York. (a) past flood risk, based on the distribution of freshwater, intertidal, and marine ecosystems, c. 1609; (b) current flood risk from multiple sources, c. 2021; (c) future flood risk from multiple sources, c. 2080; (d) Blue Zones; (e) modern watersheds derived from topography (different colors indicate watersheds); (f) assembly of Blue Zones by watershed.
After all the data were assembled, the analysis began. We overlaid our three time periods, capturing more than 500 years of flood vulnerability data in New York City and identifying the city blocks where our Blue Zone criteria were met: a place that was wet, is wet, and will be wet. These are the blocks where adaptation is most crucial. Our analysis found that 21% of the city’s land area is vulnerable to flooding, affecting approximately 1.2 million people and 11% of city buildings. Over two-thirds of the flood-prone area is estimated to be threatened by coastal flooding; 36% from combined coastal and pluvial (from rainfall) flooding; and 5% from pluvial flooding only. These results show that the city’s historical ecology provides a remarkably prescient guide to present-day flooding patterns, despite the numerous changes the New York City landscape has seen over the last 400 years.
Historical ecology offers not just a record of what once was, but a framework for anticipating what might be. Our findings suggest that resilience planning will benefit from large-scale, landscape-level planning that transcends jurisdictional and ownership boundaries. Although much of the land within Blue Zones is publicly managed, no single agency can address the city’s flooding challenge alone. Coordinated action across agencies, levels of government, and private landholders will be essential. These efforts should center on vulnerable populations that face the greatest risks of flooding. This climate resilience effort also provides an opportunity to right many housing and environmental injustices that have been perpetuated since the city was built.
Ultimately, water does not recognize political or parcel boundaries, and neither should our hydrological planning. Viewing the city as a system of interconnected watersheds provides a basis for cross-agency collaboration and interventions that restore ecological function while protecting communities. We hope our paper offers a starting point for that work, a way of understanding where flooding will occur, who will bear its consequences, and what the landscapes buried beneath our cities might yet teach us about building resilience. Read the full paper in the Annals of The New York Academy of Sciences.
To learn more about our urban conservation work at the New York Botanical Garden, visit our resource hub and sign up to receive our monthly newsletter.
SUBSCRIBE
Enter your email address to subscribe to this blog and receive updates on new posts.


